Timeplus Recipe: Get to Know Your LinkedIn Followers With SQL and Dashboards
- Jove Zhong

- Nov 30, 2023
- 6 min read
If you're managing a company's LinkedIn account, whether you have 100 followers or 100,000, you probably want to know more about your followers' profiles and demographics—such as their location, prevalent job levels, and industry. As an admin, you can see some free, out-of-the-box analytics capabilities that LinkedIn provides. However, while you can export the aggregated data as an Excel spreadsheet, you cannot customize the analytics dashboard in LinkedIn.
Wouldn’t it be better if you can set up a data pipeline to pull data from LinkedIn each hour or each day, then build custom dashboards with SQL to show your preferred charts?
On Thanksgiving Day, our Timeplus company account reached a small milestone of 2000 followers. I shared a screenshot of a Timeplus dashboard showing our LinkedIn followers’ demographics.

Many of you wanted to know more about how it is built. So, here is the recipe.
The key ingredients are:
A LinkedIn account, with administrator access to your company profile. Ideally, with extra access to your company website or domain settings.
Airbyte Cloud account (free is okay). Self-hosted Airbyte should also work.
Timeplus Cloud account (get a 30-day free trial)
Overview of key steps:
Create an OAuth2.0 app in LinkedIn and go over all verification processes and get the client ID, client secret, refresh token. This may take a couple of days, since manual review is involved. I’ll link a resource at the bottom of this blog post.
Setup a sync job in Airbyte, choose two community connectors: LinkedIn Pages as the source, and Timeplus as the sink. Since Airbyte Cloud doesn’t charge you to use community connectors, you can run these jobs for free.
Create a dashboard in Timeplus, by running a few SQL queries with simple aggregations and group by.
You also need to build lookup tables to convert value like “urn:li:region:84” to “San Francisco Bay Area”.
Update the SQL on your dashboards with JOIN to apply the lookup logic.
Step 1: Set Up the OAuth2.0 app in LinkedIn
Let me preface this by saying while this is not the most technical step, it is the most painful and time consuming. You’ve been warned, but I promise your hard work will be worth it.
To not make this blog extra long, I’ll share this guide from Airbyte. You also need to update your DNS settings to prove you own the company domain. Also, you’ll need to work with the Microsoft support team to gain the development access to the LinkedIn Community Management API. Be patient and good luck.
Step 2: Setup Airbyte (Cloud)
If you have never heard of or used Airbyte, check out my Medium blog. This turned out to be one of my most popular blogs, with 430 views. In short, Airbyte is a great tool to move data. You can sign up for their cloud for free (doc here). Good news: Airbyte Cloud doesn’t charge you to use community connectors. Since both LinkedIn pages and Timeplus connectors are community-built connectors, you can run sync jobs for free.
Assuming you’ve set up the OAuth app properly in Step 1, choose “LinkedIn Pages” source connectors, put your credentials in, along with the organization ID for your company account.

You need to create a workspace in Timeplus Cloud with a 30-day free trial. You also need to create an API key for your workspace (how in our docs), so that Airbyte can push data to it.
The Timeplus destination connector is available in Airbyte Cloud as a community connector. Choose it and put your endpoint and API key in.

Finally, create a connection to pull data from LinkedIn and send them to Timeplus Cloud.

You need to choose at least 3 streams:
follower_statistics
share_statistics
total_follower_count
You can set a prefix for the destination stream, for example, I chose “linkedin_”, so the streams in Timeplus Cloud will be “linkedin_follower_statistics”, instead of “follower_statistics”.
At the time of writing, the LinkedIn Pages connector only supporst “Full refresh | Overwrite”, which means every time when the sync job runs, it will delete existing streams if they exist, create new streams with such names, then put data in. You cannot keep the data you synced last time, which isn’t ideal. Hopefully, the Airbyte developer community will enhance it.
You may notice I set the sync frequency as “Every 24 hours”. It’s possible to set it more frequently, say every hour (Airbyte’s jobs can run at most for 1 hour. You cannot run this more frequently, according to their doc)

Step 3: Create a dashboard with SQL
Now, if you check the “Streams” page in Timeplus Cloud, you will find 3 streams with data from Airbyte.

Please ignore the “linkedin_lookups” stream, which is the lookup table we need to create in Step 4. You’ll notice that all streams have only 1 row in each.
Take linkedin_follower_statistics as an example. The schema is:

The statistics for each dimension are put in a set of string arrays. Timeplus supports complex data type, such as array, map, tuple, or json.
You can use array_join function to easily extract the nested elements in the array to a set of rows.
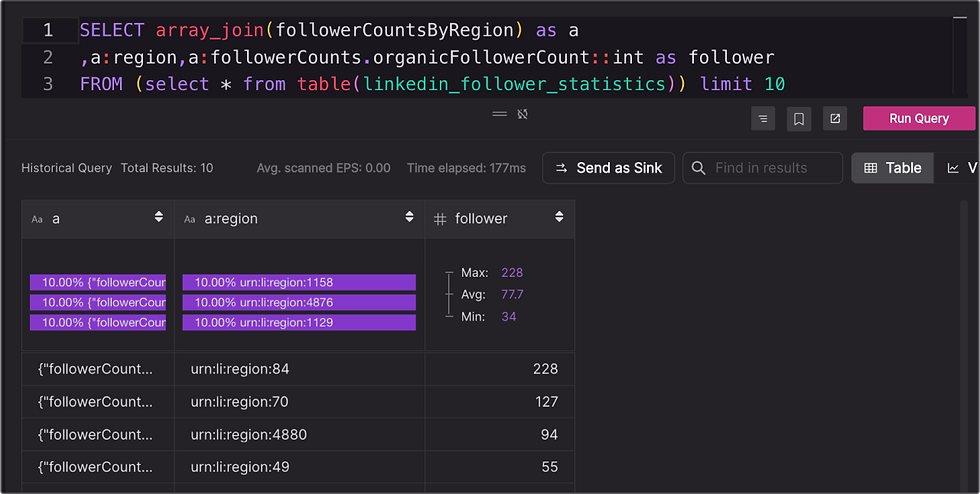
The reason why you probably want to add “limit 10” is to only show the top 10 regions in your followers. Otherwise there could be as many as 100 regions.
By default, the query result is shown in Table mode. Switch to the Visualization mode where you can easily set up a bar chart.

Nice. But wait, what is “urn:region:84”? That’s why we need the next step.
Step 4: Create lookups
URN is a fancy term to represent foreign associations to an entity (persons, organizations, and so on) in an API. Long story short, you need to download multiple JSON files from Microsoft via REST API:
linkedin_seniority.json
linkedin_countries.json
linkedin_regions.json
linkedin_industries.json
Linkedin_functions.json
First, you need to get the access token
curl -X "POST" "https://www.linkedin.com/oauth/v2/accessToken?grant_type=refresh_token&client_id=$ID&client_secret=$SECRET&refresh_token=$REFRESH_TOKEN”Then use the access token to list all values in targeted namespace, e.g.:
curl "https://api.linkedin.com/v2/regions" -H 'Authorization: Bearer $TOKEN' -H 'LinkedIn-Version: 202310' The file looks like this:
{
   "paging": {
       "start": 0,
       "count": 10,
       "links": []
   },
   "elements": [
       {
           "name": {
               "locale": {
                   "country": "US",
                   "language": "en"
               },
               "value": "Abilene, Texas Area"
           },
           "country": "urn:li:country:us",
           "id": 4,
           "$URN": "urn:li:region:4",
           "states": [
               "urn:li:state:(urn:li:country:us,TX)"
           ]
       },
What you need to create a CSV, to map the key “4” to "Abilene, Texas Area".
Sure, you can write a program in Java/Python. But my preference is the following Shell command (Thank you, ChatGPT)
cat linkedin_regions.json | jq -r '.elements[] | [.["$URN"] , .name.value] | @csv' | sed 's/urn:li:region://g' > linkedin_region.csvBy doing so, you generated 5 CSV files. But I don’t want to write a long SQL to join 5 lookup tables. So here's a trick to create a new CSV, with the 3rd column as the namespace.

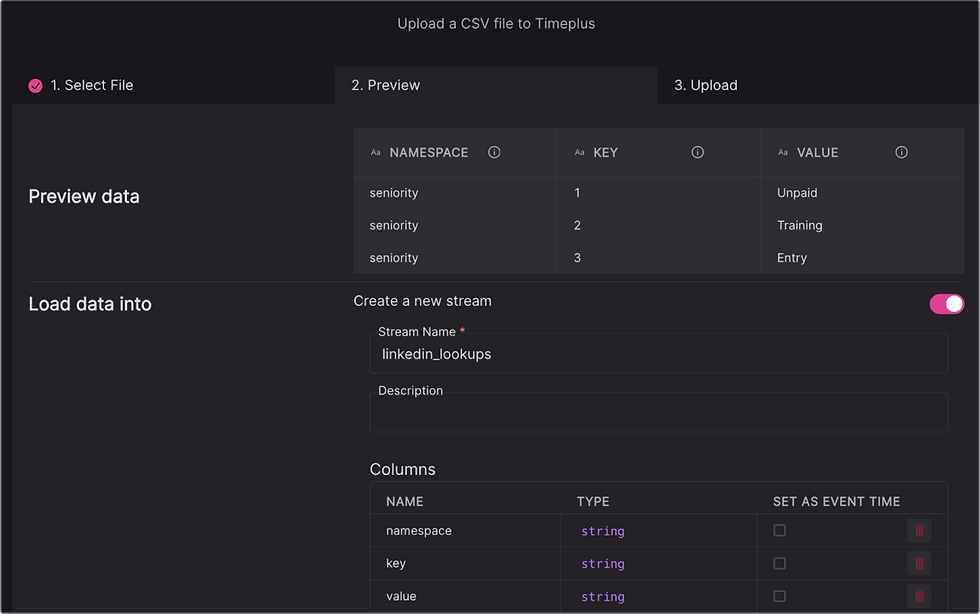
Finally you can upload the CSV file in Timeplus Cloud, to create a new stream. That’s how we get the linkedin_lookups stream with 5935 rows.

Step 5: Update the SQL with JOIN to apply the lookup logic
Okay, now we have a complete lookup table for all human-readable regions, countries, job level, etc. Let’s update our SQL to apply this lookup via JOIN.

The first 3 lines are almost identical to the SQL in Step 3. We just wrap them in a CTE call d (short for data). Then we apply “d join table(lookups)” with the matching join key as well as the expected namespace which is “region”. By doing so, you can extract the follower statistics from the array, get top regions, then convert the URN ID to readable area name, such as SF Bay Area. If you pay attention to the metrics between SQL and the table, it shows it only took Timeplus less than 0.3 second to do all the magic things.
With such enhancements, now you can update other SQL and decorate your dashboard and show it to your leadership team.
Thank you for reading this far. As you can see, Timeplus provides a great integration with Airbyte with a SQL editor, CSV upload, visualization, and dashboarding capabilities. It’s very easy to leverage hundreds of source connectors in Airbyte community and push data to Timeplus hourly or daily. Follow this tutorial to set up a customized dashboard or alerts to better understand your LinkedIn followers, and you can even do something similar for your CRM or other marketing tools.
Got questions or other ideas you want to share? Join the discussion in our Slack community.