Why Are Your Telemetry Pipelines Failing?
- Gang Tao

- Nov 18, 2025
- 7 min read
Updated: Dec 11, 2025
And How Timeplus Solves Them
If you’re operating large-scale logs, events, metrics and traces data, you've likely faced this painful reality:
You're paying millions to index billions of events every day, yet 80% of them are noise.
Dashboards stall because enrichment only happens at query time, batch pipelines are taking too long, and processing functions before indexing are extremely limited.
Most critically, your alerts arrive 15 minutes after critical incidents like breach have already begun.
This isn't just an operational annoyance. It's a multi-million dollar problem that impacts both your infrastructure costs and your security posture.
Why Traditional Telemetry Pipelines Fall Short
Traditional telemetry pipelines treat your observability data as something to be passively moved from point A to point B. They parse, they route, they store, but they don't think. They are limited by:
Processing delay: Logs queue at each stage
Complexity: Different languages, different configuration paradigms
Cost: You pay to store everything before filtering the noise
Rigidity: Making changes requires touching multiple systems
Most critically, they can't ask questions like:
"Are we seeing connection attempts to this IP from 10+ different sources simultaneously?"
"Is this pattern of events consistent with a brute force attack in progress?"
By the time your data reaches a system that can answer these questions, the critical moment has passed.
The Timeplus Difference: Rethinking Telemetry Pipelines
Timeplus takes a fundamentally different approach by providing stateful stream processing with built-in analytics and alerting, all through familiar SQL syntax. Rather than treating your observability pipeline as a simple data shuttle, Timeplus transforms it into an intelligent, real-time analysis engine.

What Makes Timeplus Different?
Unified Data Transformation
Through SQL, Timeplus consolidates all essential data transformation capabilities into a single, unified SQL layer. Rather than combining multiple tools with different configuration languages and philosophies, you can filter noisy events, deduplicate redundant data, route to multiple destinations, enrich with contextual information, and trigger alerts—all within the same streaming SQL framework. This unified approach eliminates the complexity of maintaining separate systems for each transformation step, reduces operational overhead, and provides a consistent interface for your entire team. Whether you're a security analyst writing alert queries or a platform engineer optimizing data pipelines, you're working in the same familiar SQL dialect.
True Stateful Data Streaming Processing
While traditional tools like Logstash offer static rule-based filtering and Cribl provides basic time-window operations, Timeplus delivers true stateful stream processing with sophisticated temporal analytics. This means you can perform complex time-window aggregations that maintain state across events, join streaming data with reference tables using standard SQL joins, and correlate patterns across multiple event streams. This capability transforms your pipeline from a simple data shuttle into an intelligent processing engine that understands context, remembers history, and recognizes patterns as they happen.
Real-Time Alerting Without External Dependencies
Unlike traditional architectures that require separate SIEM tools and introduce inevitable latency through batch processing, Timeplus provides built-in sub-second alerting as a native feature of the streaming engine. Alerts fire immediately as threatening patterns emerge in the data stream, not minutes later after logs have been indexed, stored, and eventually queried by a scheduled job. This eliminates the architectural delay inherent in systems where alerting is treated as an afterthought. Security events trigger responses in hundreds of milliseconds instead of minutes, giving your team the critical time advantage needed to respond to active threats. The alerting logic lives right alongside your data transformation logic, expressed in the same SQL syntax, making it easy to iterate and refine detection rules as your threat pattern evolves.
How It Works: Cisco ASA Firewall Use Case
Now let's take a look at a real-world example that illustrates these concepts in action.
Imagine you're responsible for monitoring Cisco ASA firewalls to protect your enterprise network. These devices collectively generate about 2 million events per hour, which means roughly 1.5 terabytes of log data every single day. The sheer volume is overwhelming, but the real problem runs deeper than just the data size.
Approximately 80% of these events are routine INFO-level messages: health checks confirming that systems are running, keepalive packets maintaining connections, and other operational noise that rarely requires human attention. Your high-availability firewall pairs create duplicate events as both the primary and standby units report the same activity. Meanwhile, the critical security events you actually need to see—denied connection attempts, authentication failures, potential attack patterns—are buried under this avalanche of noise. The cost of indexing and storing everything in Splunk has boomed, and your security analysts are drowning in false positives and alert fatigue. By the time meaningful alerts surface through your current pipeline, time has already elapsed, and potential attackers have had precious time to advance their objectives.
This is the exact scenario I want to talk about today, addressed with Timeplus. In the following walkthrough, I'll show you how to build an intelligent observability pipeline that cuts through the noise, detects threats in real-time, and dramatically reduces both costs and response times. We'll tackle each challenge systematically: filtering the noise, deduplicating redundant events, routing different event types appropriately, and most importantly, detecting security threats like brute force attacks and DDoS patterns the moment they begin, not minutes after the fact.
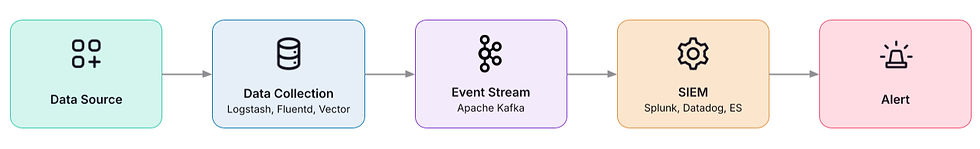
Here is the data pipeline diagram we are going to explore:

Step 0: Get Data In

All the cisco asa logs are collected and sent to a kafka topic, we leverage Kafka external stream to get those logs data in real time.
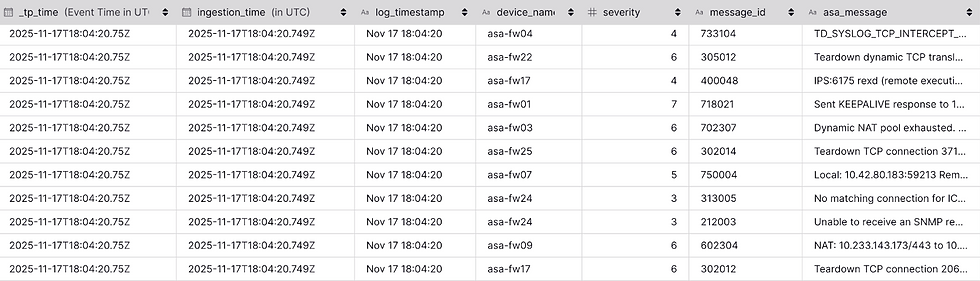
The cisco asa logs data looks like this:

The external stream of the logs only has one string field `message`
Step 1: General Extraction
First, we create a Materialized View to normalize the raw log format using Grok patterns, all the asa logs follow this same pattern:
This extracts common fields from all ASA logs, creating a normalized stream called `parsed_asa_logs`

After this step, we turn the unstructured logs into a structure table, while the asa message part is still an unstructured log based on different message_id, but we get some universal fields including, log time, device name, severity and message id.
Step 2: Noise reduction with Sampling, Filtering and Dedup
Next, we use some realtime SQL to do some noise reduction work.

Rather than keeping everything, apply smart sampling first:
This keeps all events with severity 5 or higher (important events), while sampling only 1% of low-severity noise. Result: 80% data reduction while maintaining visibility.
Next, use filter to keep critical events or drop known noise:
Here is where Timeplus really shines. Use a 5-minute window to eliminate duplicates from HA pairs with dedup:
This keeps only the first occurrence of each unique combination within a 5-minute window.
In real scenarios, users should decide how to use these transformations, and do not need to follow the same order here.
Step 3: Dynamic Routing
Route different event types to appropriate destinations:

In this demo, we send all critical events to Splunk and also send the authentication as audit log to S3 based on the routing label we added by the view `v_routed_as_logs`
Real-Time Intelligence: Critical Alerts
Now let's take a look at the other branch of the pipeline, the game-changer: in-pipeline alerting that detects threats in real-time.

Timeplus alerts provide native real-time monitoring and notification capabilities built directly into the streaming SQL engine, allowing users to detect critical conditions and trigger actions the moment patterns emerge in your data streams. Unlike traditional alerting systems that rely on scheduled batch queries or external SIEM tools, Timeplus alerts continuously evaluate streaming queries and fire immediately when conditions are met—often in sub-second timeframes. Users can define alert logic using the same familiar SQL syntax, then configure how and where to send notifications through integrations with Slack, PagerDuty, webhooks, or custom destinations. The integration is defined as Timeplus python UDF, so it is very easy to extend.
This integrated approach eliminates the architectural latency inherent in systems where data must first be indexed and stored before being periodically queried for alert conditions, enabling you to respond to security threats, operational anomalies, and business-critical events as they happen rather than discovering them minutes or hours later.
As alerts are business logic related, we need to extract more information from the raw asa logs, so first we will need specific extraction for different message types (defined with message id here)
Event-Specific Extraction

We can parse different message types with specific Grok patterns like this:
The Grok patterns extract a map(string,string) for each different message id, to make the follow up analysis simpler, we turn the complex type into a flatten table.
After this transformation, we now have a flatten stream `flatten_extracted_asa_logs` with all the fields ready to be used for the next step.
Alert 1: Critical Events (Simple Condition)
The first type of alert is simple, it will trigger based on one simple condition, if the severity is 1 (we use < 2 here as user might want to change the threshold to different level)
Alert 2: Brute Force Attack Detection (Stateful Aggregation)
The second one triggers a critical alert when any user has 30+ authentication failures within a 1-minute window.
This is where stateful stream processing becomes essential and most of the other stateless pipelines cannot handle such case.
Alert 3: DDoS Attack Detection (Advanced Pattern Recognition)
The third one detects distributed attacks by identifying when a single target receives 100+ connection attempts from 10+ different sources within 30 seconds.
This is also a stateful processing use case where Timeplus SQL can be used to detect complex event patterns.

In this demonstration, we create a view that union all these three different types of alerts and use one alert to trigger it. In real scenarios, users can create dedicated alerts for each of different types of alerts.
For more information about Alert, refer to https://docs.timeplus.com/alert
Conclusion
Traditional observability pipelines treat logs as passive data to be shuttled from point A to point B. But in a world where security threats evolve in seconds, not minutes, we need pipelines that think, not just transport.
Capability | Logstash | Cribl | Timeplus |
Parsing | ✅ Grok patterns | ✅ Route by fields | ✅ SQL + Grok |
Filtering | ✅ Static rules | ✅ VRL scripts | ✅ Real-time SQL |
Deduplication | ⚠️ Limited with aggregations | ⚠️ Basic Time window | ✅ Stateful |
Enrichment | ⚠️ Stateless lookups | ⚠️ Stateless lookups | ✅ Stream/Stream-table joins |
Real-Time Alerts | ❌ None | ❌ None | ✅ Built-in (Subsecond) |
Traditional telemetry pipelines were built for processing—parse, forward, store, then analyze. But modern threats move in milliseconds, not minutes. Timeplus doesn't just replace Logstash or Cribl—it collapses your entire observability stack into a single streaming SQL layer.
Filter noise before it costs you.
Deduplicate intelligently, not blindly.
Enrich once, not per query.
Alert in <1 second, not after the breach.
Timeplus rethinks the observability pipeline by making it:
Intelligent stateful processing and pattern detection
Real-time sub-second alerting
Cost-effective process and filter before expensive storage
Familiar standard SQL, no new DSL to learn
The question isn't whether you can afford to modernize your observability pipeline—it's whether you can afford not to.
Timeplus has open sourced its core engine and is available on GitHub. The platform runs anywhere—cloud, on-premises, or in your Kubernetes clusters.
Download and try Timeplus:
Sample Pipeline Code: github.com/timeplus.io/examples/tree/main/cisco_asa_log/timeplusd_script
Star us on GitHub:
Join our community:


